mohit / gaming industry analysis
Gaming Industry Analysis
40 years of video game sales.
You've read the headlines. Sales are up, sales are down, consoles are dead, consoles are back. Each story picks a different year and a different chart, and none of them agree on when the industry peaked or why it slid.
I wanted the full picture, so I took 16,598 games released between 1980 and 2020 and ran a complete exploratory analysis on them.
Pandas cleans the data and aggregates sales by region, platform, genre and publisher. Matplotlib and Seaborn turn the results into more than a dozen charts, each with a short note on what it shows and what it hides.
Think of it as an industry report where you can read the code behind every chart.
What it shows
- Compare three markets. North America takes about 49% of global sales. Europe tracks it closely, with a correlation of 0.90 against the global total. Japan sits at 0.61, which makes it a different market with its own tastes.
- Pinpoint the peak. Sales crest in 2008 and 2009, when the PS3, Xbox 360, Wii and DS all competed at once.
- Follow genres across generations. Platformers defined the 80s, then Action and Shooter took over. Action now holds about 19.6% of global sales, and Japan leans much harder into Role-Playing than the West.
- Trace platform lifespans. The PC and Atari 2600 ran for decades. Modern consoles live shorter and sell faster.
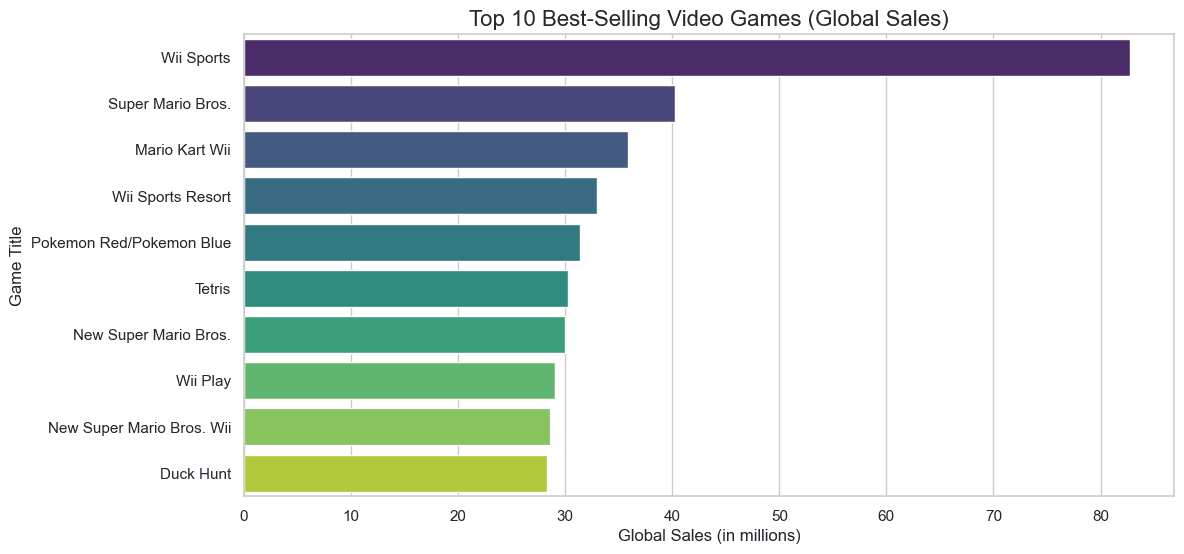
- Weigh publishers by strategy. EA releases the most games, mostly annual sports titles. Nintendo releases fewer and earns more per title, with 7 of the 10 best-selling games.
Where the data stops
The dataset covers neither digital storefronts nor mobile, so the sharp drop after 2010 overstates the decline. Wii Sports leads with 82.74M units, and console bundling inflates that figure. 271 missing release years were filled with the most common value.
No API keys. No extra downloads. The dataset ships with the notebook.
Built with Python, Pandas and Matplotlib, with Seaborn for heatmaps and Folium for the regional map.